

Determining cut-off values
ACOMED statistik is a statistical service provider specializing in the planning and evaluation of diagnostic studiesWe continue to offer Statistics consulting
and Statistics training
Furthermore, we support companies in the pharmaceutical industry, Medical device industry
as well as CRO in the statistical planning and evaluation of clinical studies and in the SAS programming.
This page provides information on cut-off values, their calculation, application, and interpretation. If you require assistance with planning and analyzing your diagnostic study, please do not hesitate to contact us (Tel.: 49 (0) 341 3910195).
Determining cut-off values as a regulatory task
Manufacturers of diagnostic tests are required to specify values that divide the range of measured values into test positives and test negatives. This value – the cut-off value – is one of the characteristics of a diagnostic test. This is also stipulated by the new EU Regulation 2017/746.
Determining the cut-off as a medical task
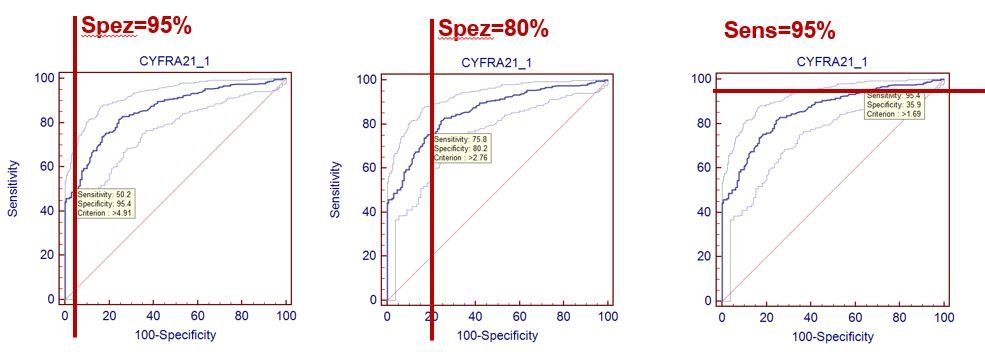
Different cut-off values are associated with different sensitivity and specificity values, representing a trade-off: higher sensitivities are associated with lower specificities and vice versa. This trade-off is clearly illustrated in the following figure.

Therefore, determining the cut-off is primarily a clinical/medical, and possibly also a health economic, problem: Do we want to use a test with high specificity (few false positives) or with high sensitivity (few false negatives)?
The following figure shows such specifications using the example of the tumor marker Cyfra 21-1 for bronchial carcinoma (data from: Keller T, Bitterlich N, Hilfenhaus S, Bigl H, Löser T, Leonhardt P (1998): Tumor markers in the diagnosis of bronchial carcinoma: new options using fuzzy logic based tumor marker profiles. J Cancer Res Clin Oncol 124: 565-574),
where the ROC curve
is used to help.
An example of such a definition is the PSA test for diagnosing prostate cancer in men: Here, the cut-off is chosen to achieve high sensitivity (approx. 90%), while accepting a very low specificity (30 ... 40%) with the corresponding consequences (e.g., invasive follow-up examinations).
Conclusion for determining cut-off values:
From a clinical medical perspective, the crucial step is therefore to define the specificity or sensitivity that the test should exhibit. Then, the corresponding cut-off value is determined, and the associated sensitivity or specificity is specified.
This has an important consequence: the frequently encountered determination of the cut-off value via criteria such as maximum diagnostic accuracy is not effective.
Determining the cut-off as a statistical task
Estimating the cut-off using statistical methods is similar to estimating a percentile in a distribution. For example, if the cut-off is to be determined at 90% specificity, the 90th percentile of the distribution of healthy individuals must be specified. Several methods are available for this; typically, the percentile is determined nonparametrically. This is also the approach recommended by the corresponding CLSI guideline EP28-A3. This guideline specifies a sample size of 130, which, however, depends on various boundary conditions.
It is important to be aware of the uncertainty in the percentile estimates. This can be expressed by the confidence interval, with the CLSI EP28-A3 guideline using the 90% confidence interval. This is (unexpectedly) wide, as the following figure illustrates for the Cyfra 21-1 cutoff from the study mentioned above:

The figure shows the distribution of benign cases (N=131), together with the cut-off (3.2 ng/ml) for a predefined specificity of 85%, together with the 90% confidence interval (2.8 - 3.9 ng/ml).
Although the sample size is quite large at 131, the cut-off is rather uncertain.
Conclusion: The cut-off value should be specified along with its confidence interval.
It is also evident that the distribution of benign cases is heterogeneous; in particular, the right "tail" of the distribution is clearly composed of sub-distributions. Therefore, determining the cut-off using parametric methods is virtually impossible.
The inadequacy of determining the cut-off value via the maximum diagnostic accuracy is also evident from a statistical point of view: If one determines the confidence interval for this cut-off estimate (lower left of the figure), it is significantly wider than in the example shown above.
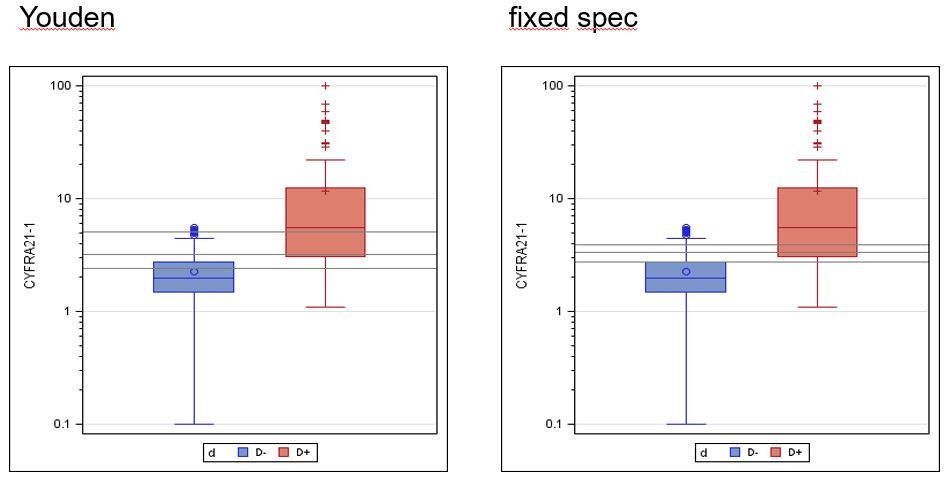
Cut-off and confidence interval (grey horizontal lines) for maximum Youden index (left) and fixed specificity (right):
Youden index: 3.2 ng/ml, 90% CI: 2.4 - 5.0 ng/ml
Fixed specificity: 3.2 ng/ml, 90% CI: 2.8 - 3.9 ng/ml
Note: The fact that the cut-off values are the same is a coincidence.