

VBA programming for evaluation tools in the laboratory
ACOMED statistik works for clinical research laboratories in the pharmaceutical industry, for IVD manufacturers, and in laboratory medicine. In addition to statistical planning and analysis, routine evaluations sometimes require standalone tools that offer the user-friendliness of Excel, the statistical methodological versatility of R, and the FDA-level validation depth. ACOMED statistik provides customized software solutions in MS Excel (VBA programming, optionally with integration of R programs).
As the two examples show, the tools usually arise in connection with development work regarding statistical methodology.
These Excel solutions are extensively validated depending on the client's requirements (e.g., dual programming, parallel programming in SAS, verification using examples including some unfavorable scenarios, etc.).
It should be noted that these are time-consuming and costly projects. The specifications were developed jointly with the client. This interactive process requires a level of flexibility from both sides that is typically found in long-standing, successful business relationships.
Example: Evaluation of a precision experiment according to CLSI EP05 for a multiparameter assay for IVD manufacturers
Task:
For a multiparameter assay with approximately 20 parameters, a precision experiment according to CLSI EP05 with the factors day and lot will be performed on patient samples. This experiment will determine the repeatability as well as the between-lot and between-day precision for each parameter. Only a limited amount of sample material is available per patient. Furthermore, the concentration of each measured parameter cannot be controlled.
Methodical solution:
The experiment will be conducted on numerous samples, generating measurement results over three days with three lots in three replicates. Sample selection will be checked to ensure that the measurement ranges for all parameters are covered. The precision results will be pooled (statistically) across the samples. The number of required samples will be determined through simulations. A prerequisite for the (statistical) pooling of results is homogeneity of variance across the measurement range; that is, for each parameter, either the standard deviation or the coefficient of variation (CV) must be independent of the concentration.
VBA solution:
The data is imported, although there may be variability regarding the number of values of the factors, the measurement parameters, and the number of samples. Outlier detection is performed. A graphics window allows for quick navigation through the measurement results; outliers are highlighted. The variance components are estimated using an R program integrated into the Excel tool. The results are stored in a separate, printable, and savable spreadsheet.

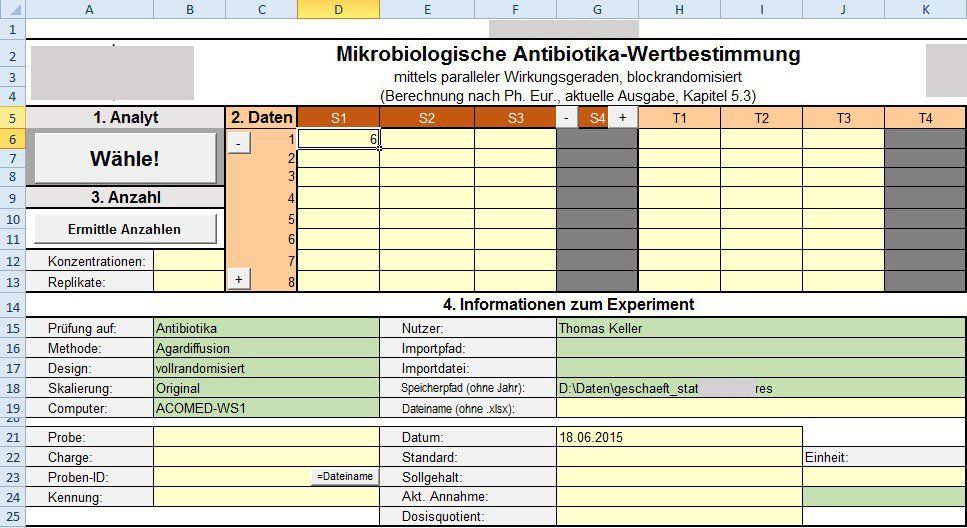
Example: Tool for determining value using parallel lines of action for pharmaceutical testing laboratories, including the development of new criteria for the validity of experiments.
Task:
In an existing tool, a large number of experiments were found to be invalid according to the procedure outlined in the guideline (Chapter 5.3 of Ph. Eur. 7 2011) (signals from the significance tests for deviation from parallelism or homogeneity of variances). The reasons for this had to be determined.
Methodical solution:
The significance tests were not applied adequately in the guideline; the aim is to prove the null hypothesis, for which statistical tests are not suitable. This has also been described in the literature [Hauck Walter W., Assessing Parallelism Prior to Determining Relative Potency, PDA J. Pharmaceutical Science Technology 59:127-137)]. E
Equivalence tests must be formulated. For parallelism, the Fileler confidence interval was used for the ratio of the increases. (This approach is now also provided for in a newer version of the guideline – alongside the old approach.)
Furthermore, the equivalence limits need to be defined. Historical data was used for this purpose. This led to the task of programming a new tool. These limits are checked annually.
VBA solution:
Development of a tool for a range of typical experiments with different designs and varying numbers of replicates. Integration of an R tool for calculating the Fileler AI. Detection of any erroneous inputs. Validation through parallel programming in SAS and extensive test runs. The results are stored in a separate, printable, and savable spreadsheet. These saved results can later be imported using a separate tool to verify historical limits.
Literature: Development of an appropriate statistical procedure
for the evaluation of parallel line assays, 2014, p. 3. link